

Start with your natural profile and find your dominant trait first, before anything else on the page. Then compare that natural graph against your adapted and stress profiles to spot any large gaps, since a gap tells you more than a single high score ever will. Finally, look at your two-letter blend, not just your top letter, because that combination is where your actual behavior pattern lives.
TL;DR:
- Large gaps between natural and adapted profiles signal significant behavioral shifts that may cause fatigue or role mismatch if they persist over several months.
- Comparing the natural, adapted, and stress profiles reveals how environmental pressures influence behavior, with the stress profile often closer to natural tendencies.
- Scores far above or below the midline indicate strong or suppressed traits, while near-midline scores suggest greater flexibility and adaptability.
- Most common blend combinations, such as D/I or S/C, provide clearer behavioral insights than relying solely on the top letter, aiding precise role matching and communication.
- Effective report use involves focusing on the biggest adaptation gaps and designing small, specific experiments to improve team dynamics or communication.
Table of Contents
- What Does a DISC Report Actually Measure?
- The Four DISC Styles, In Plain Terms
- How Do You Read the Graphs on Your Report?
- What Your Score Blends Actually Mean
- What a Big Gap Between Natural and Adapted Means
- Turning Your Report Into Action
- A Practitioner's Checklist for Reading Reports Well
- Why the Gap Matters More Than the Label
- Get an Actionable DISC Report Built for Real Use
- Sources
What Does a DISC Report Actually Measure?
DISC measures observable behavior across four dimensions: Dominance, Influence, Steadiness, and Conscientiousness. It plots your relative tendencies on each of those four dimensions, usually as bar graphs, plotted points, or a circle chart. It does not measure intelligence, values, or mental health, and treating it that way is the single most common mistake people make when they first open a report.
A standard report from most providers contains a handful of recurring pieces. Once you know what each one is for, decoding a report from any vendor becomes far less intimidating.
- Natural profile graph: how you behave under normal, low-pressure conditions.
- Adapted (or position) profile graph: how you behave when you feel the environment expects something different from you.
- Stress or intuitive profile: your gut reaction under real pressure, often closer to your natural wiring than your adapted self.
- Circle or radar chart: a visual map of where your traits sit relative to each other.
- Narrative sections: plain-language descriptions of your dominant style, strengths, and potential blind spots.
- Application tips: practical notes on communication, teamwork, and management style.
Every graph in a DISC report is built around a midline, sometimes called the energy line. Scores above that line indicate the trait is more active or intense in your behavior; scores below it indicate the trait is less active. Distance from the midline matters more than the raw number. A score sitting far above the line signals a strong, consistent behavioral pull, while a score just above it is a mild lean, easily overridden by context.
The Four DISC Styles, In Plain Terms
Every letter on your report describes a behavior pattern you can recognize the moment you see it in action, in yourself or in a colleague across the table. High and low scores in each dimension map to fairly predictable patterns in how people communicate, decide, and pace their work.
- Dominance (D): High D pushes for fast decisions and confronts conflict directly, sometimes bluntly. Low D hangs back, prefers consensus, and avoids direct confrontation even when a decision is overdue.
- Influence (I): High I thrives on social energy, persuasion, and being seen. Low I prefers working quietly and is often uncomfortable being the center of attention in a room.
- Steadiness (S): High S values a steady pace, predictability, and loyalty to the team. Low S adapts quickly to change and gets restless with repetitive routine.
- Conscientiousness (C): High C wants accuracy, documented process, and clear rules. Low C moves faster than the details allow and is comfortable improvising past a gap in the plan.
In a meeting, the high D interrupts to get to the point. The high I fills silences and reads the room's mood before anyone else does. The high S waits patiently and worries quietly about the team's morale. The high C is already asking who is going to document the decision.
Pro Tip: Don't read your top letter as your whole personality. A single high score describes a tendency, not a ceiling on what you're capable of doing well in other modes.
How Do You Read the Graphs on Your Report?
Reading the charts in the right order matters as much as reading them at all. Most professional DISC reports follow a three-profile convention: natural, adapted, and stress. Reading them out of order is how people misinterpret their own results.
- Read the natural profile first. This is your baseline, the behavior you default to without thinking about the room you're in.
- Read the adapted profile second. This shows how you believe you need to behave in your current role or environment. Compare it point by point against the natural graph.
- Read the stress or intuitive profile third. This surfaces under real pressure and often reveals patterns closer to your natural wiring than your adapted mask lets on.
On a bar-style graph, anything sitting well above the midline signals a strong, active trait; anything well below signals suppression of that trait, whether intentional or situational. A point sitting close to the midline is neutral territory, more flexible and context-dependent than a sharp peak or valley.
Circle or radar charts work a little differently. Instead of four separate bars, your styles get plotted as a single dot (or a small cluster of dots) somewhere inside a wheel divided into D, I, S, and C quadrants. A dot sitting near the boundary between two quadrants tells you that you carry meaningful traits from both neighboring styles, which is exactly how a two-letter blend shows up visually.
Here's your quick checklist for any DISC report layout, regardless of vendor:
- Look first at the natural graph to find your baseline dominant trait.
- Look second at the adapted graph and note any point that moved significantly from natural.
- Look third at the stress graph to see what surfaces when the adaptation breaks down.
What Your Score Blends Actually Mean
Your top letter alone is a headline. Your blend is the story. Most people carry a primary style and a secondary style close behind it, and that combination shapes how you actually behave in a meeting far more precisely than either letter on its own. To build your blend, find your highest score, then your second-highest, and read them together rather than in isolation.
A few common combinations show up again and again in workplace reports:
- D/I: Fast-moving and persuasive. This person drives a room toward a decision and sells the room on it at the same time, but can steamroll quieter voices in the process.
- D/C: Results-focused and detail-driven. Expect precise deadlines, high standards, and low patience for sloppy process.
- S/C: Steady, accurate, and process-loyal. This person is the one who catches the error nobody else noticed, but may resist sudden change even when the change is overdue.
- I/S: Warm and relationship-oriented. Strong at building team cohesion, sometimes slow to deliver hard feedback when it's needed.
Scores that sit right near the midline in every dimension deserve their own note. They usually indicate flexibility rather than indecision, meaning the person adapts easily across roles but may need more structure to find their own natural fit. Low scores matter too, particularly in development planning: a low C paired with a leadership role heavy on compliance work is a mismatch worth naming early, not after a missed deadline.
What a Big Gap Between Natural and Adapted Means
A large gap between your natural and adapted profiles is often the single most useful signal in the whole report. It usually points to meaningful behavioral adaptation to your environment, and that adaptation carries a real energy cost when it runs for too long.
The key distinction is temporary versus chronic. A short-term gap tied to a specific project, a new manager, or a stretch assignment is usually healthy stretching, the kind that builds range. A gap that has persisted for months, especially one paired with reported fatigue or disengagement, tends to signal role strain rather than growth. The behavior itself might look identical on paper; the context is what tells you which one you're looking at.
Pro Tip: Ask yourself three questions before assuming a gap is a problem: Has this gap existed for more than three months? Does the person report feeling drained by it, specifically, rather than by workload in general? Would closing the gap require a skill they don't yet have, or a role change they actually want? The answers point you toward skill development, role redesign, or a simple accommodation, three very different fixes for what can look like the same gap on a graph.
Turning Your Report Into Action
A report you read once and file away has wasted your time. The value shows up when you translate the graphs into a script you can actually use in your next conversation.
- With a high D, lead with the bottom line, skip the preamble, and give them a decision to make rather than a story to follow.
- With a high I, connect socially first, and let enthusiasm build before you pin down the details.
- With a high S, give advance notice of change and confirm you value their consistency before asking for something new.
- With a high C, bring the data, expect questions about process, and never rush the review.
Role fit follows three simple rules once you know a person's blend: match a high D/C to roles with clear deadlines and real decision authority, match a high I/S to relationship-heavy roles like client care or volunteer coordination, and never assign a high C to a role that rewards fast improvisation over accuracy without giving them a transition plan first.
Pro Tip: Pick one experiment, not five. Try a single communication adjustment for one week, ask for direct feedback on whether it landed, and only then consider a bigger stretch assignment tied to what the profile revealed. Practitioner guides consistently point to short, specific experiments as the highest-value next step after reading a report, more useful than any amount of re-reading the narrative section.
A Practitioner's Checklist for Reading Reports Well
Coaches at DISC Assess use a short session structure that works whether you're reading your own report or someone else's: confirm the natural profile matches how the person sees themselves, map where the biggest adaptation shows up and what it costs them, then agree on one measurable behavioral experiment to test over two weeks.
Three misreads show up constantly, even among experienced managers. People treat DISC as a measure of ability rather than behavior. People over-interpret a low score as a weakness rather than a simple absence of that particular tendency. And people label a colleague permanently based on one report, forgetting that behavior shifts as roles and circumstances change, which is exactly why reassessing after a major role change matters.
- Confirm the natural profile with the person, not just the page.
- Map the adaptation and name its actual cost.
- Set one measurable experiment, not a full personality overhaul.
Why the Gap Matters More Than the Label
I've watched small teams and nonprofit boards spend hours debating whether someone is "really" a D or an S, when the more useful conversation was always about the gap between their natural and adapted graphs. One small nonprofit I've seen referenced in coaching notes restructured a program coordinator's role after her adapted profile showed a heavy C mask sitting over a naturally high I, natural profile. The fix wasn't a personality overhaul. It was moving detail-heavy reporting off her plate and onto someone whose natural profile actually matched that work.
That's the real payoff of reading a report well: not a label, but a specific, testable change. Templates for running that kind of quick team workshop are worth building into any staff meeting where a report just got opened for the first time.
— Tres
Get an Actionable DISC Report Built for Real Use
Reading a report well starts with having one worth reading, and Some DISC providers build reports around graphs like natural, adapted, and stress profiles, plotted clearly, with plain-language application tips instead of dense jargon.
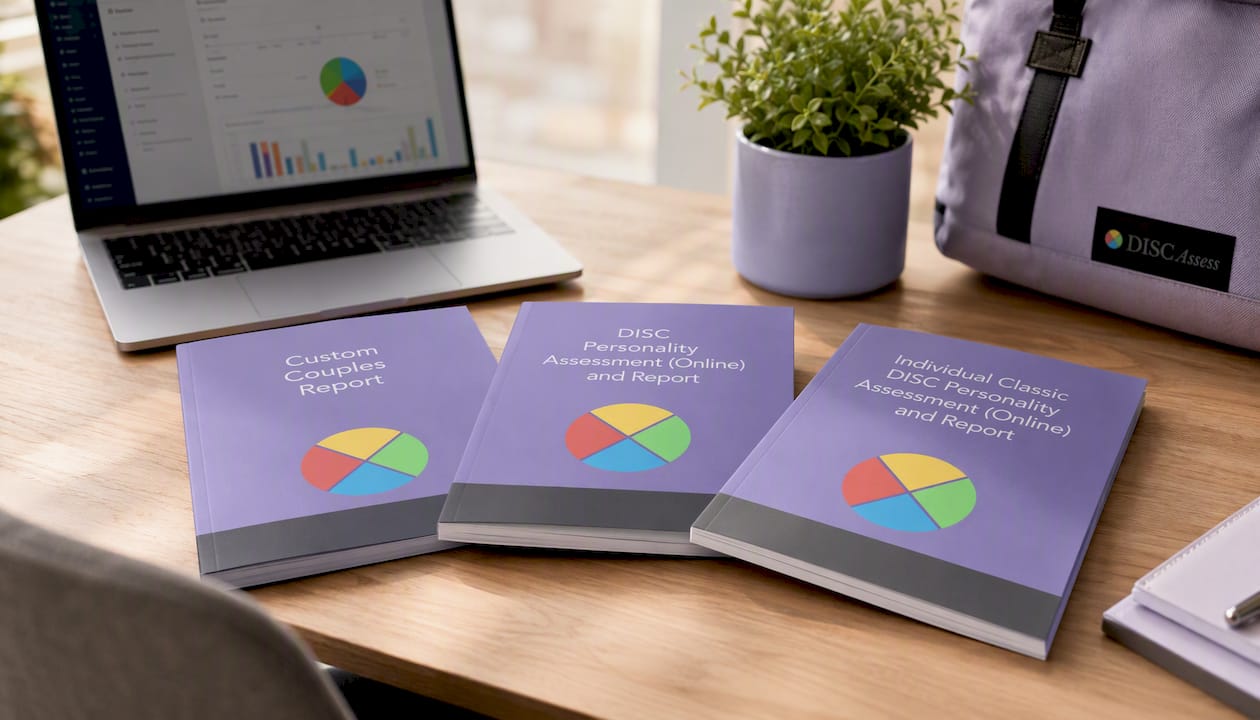
If you're evaluating your own style, the Individual Classic DISC Personality Assessment delivers an instant report built for exactly this kind of self-read. Couples working through communication patterns together can use the Custom Couples Report to compare blends side by side. And teams or organizations running this for staff or volunteers on an ongoing basis should look at the full DISC Personality Assessment and Report, which pairs the same instant report with group admin tools for tracking multiple profiles at once. Start with a single assessment, or set up a group package if you're planning a team workshop around the results.
Sources
For deeper study beyond this guide, the Wikipedia entry on DISC assessment covers the model's four dimensions, NCBI's review of personality assessment covers its proper workplace limits, and the Discassess coaching guide offers a practical session template for reading reports with real clients.
- DISC assessment — Wikipedia
- How to Read DISC Personality Assessment and Test Results — Interact Global
- DISC analysis: what it measures, how to read your results, and what it misses — Pigment
- How to read a DISC assessment: Results & graphs — ClimbTheLadder